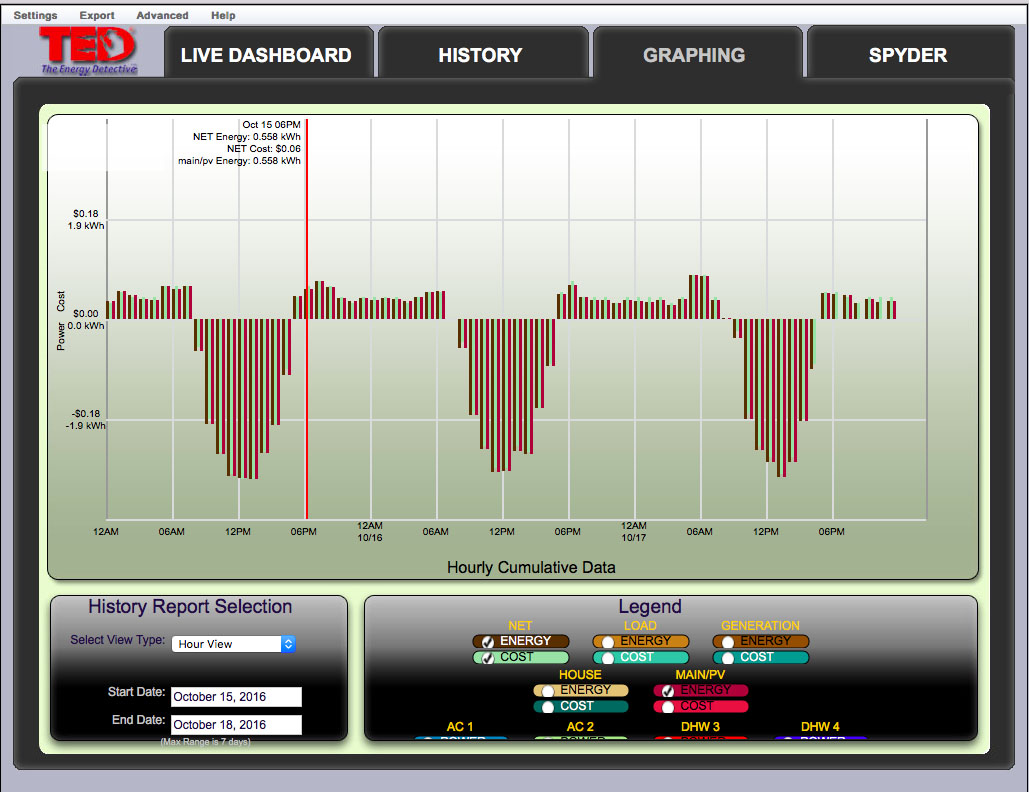
After a bit of fiddling, we have most of the energy monitoring equipment working and the data looks good. What this graph shows is 3 days and 3 nights of electricity generation and usage (midnight on Oct 15 to midnight Oct 18).
When it’s dark outside, about 5pm to 7am, the data above the centerline shows the energy being used, drawn from the electrical grid. When the sun is up, about 7am to 5pm, the data below the centerline shows the net generation (the electricity generated minus the electricity used) of the 4.1 kWh PV system during the day.
This quick glimpse shows we are generating more than TWICE the electricity that we draw from the grid and these were unusually cloudy days in Campo! Once we get the rest of the equipment online, we’ll be able to tell which circuits use the most electricity and we’ll post more data then. The ultimate goal is to have all of this data available online in real time.
If you are one of the many who donated to our fundraising campaign, thanks again for your part in making this monitoring possible!